IVCAD Suite Frontend
Define RF signal testing models, start with basic measurements and create custom measurement or simulation scripts and templates for data analysis
Prepare Your Workflow
The IVCAD Frontend (IVF) module is essential for all engineers, enabling basic measurements of RF circuits and devices, as well as controlling instrumentation for both scalar and vector measurements.
Modulate RF signals have a wide range of parameters, including bandwidth, number of samples, peak-to-average ratio, and crest factor reduction (CFR), among others. When replicating lab signals in a virtual simulator, it's easy to make mistakes. The Front-End Module eliminates this risk by offering a user-friendly, consistent interface that bridges both environments. It also provides effective tools for sequencing different test or simulation phases through scripting tools or sequencers. The collected data can be analyzed via custom views created within the Whiteboard tool, which can also be shared among users.
IVCAD Suite Frontend - IVF
- RF Measurement Control - Real & Virtual
- Waveform Generator
- Scripting Tool
- Whiteboard Data Analysis
Start Your Journey with Easy Scalar Measurements
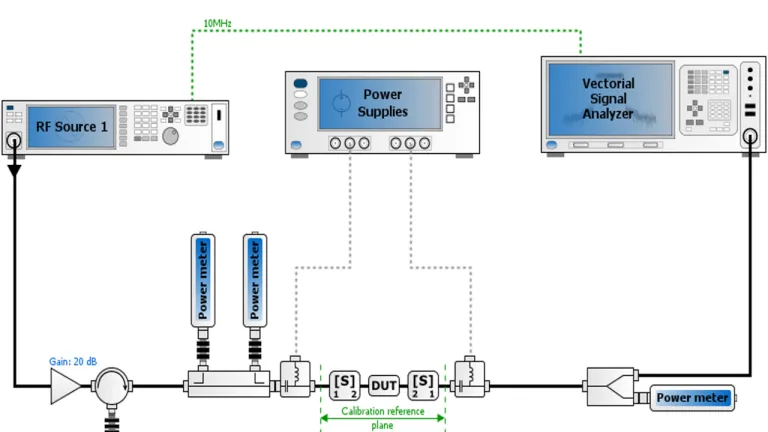
The IVF Module ensures proper measurement conditions for a device in a 50-ohm environment. IVF replicates the lab instrumentation setup in a schematic representation within IVCAD Suite, which can be easily reconfigured on the fly as the lab setup changes for each measurement. IVF supports both wafer and in-package measurements.
Each instrument selected in the setup is controlled using specific drivers, enabling full automation of the measurement process. With over 20 years of experience in device characterization software development, IVF excels at instrument control maximizes measurement speed without compromising accuracy.
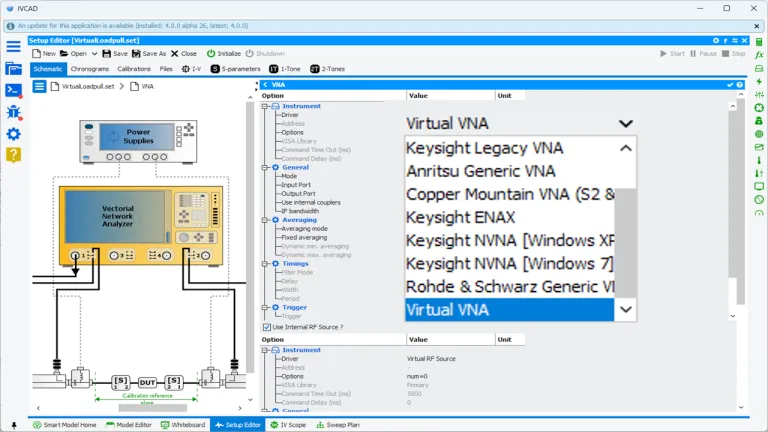
Keep Pace with RF Vector Bench Control
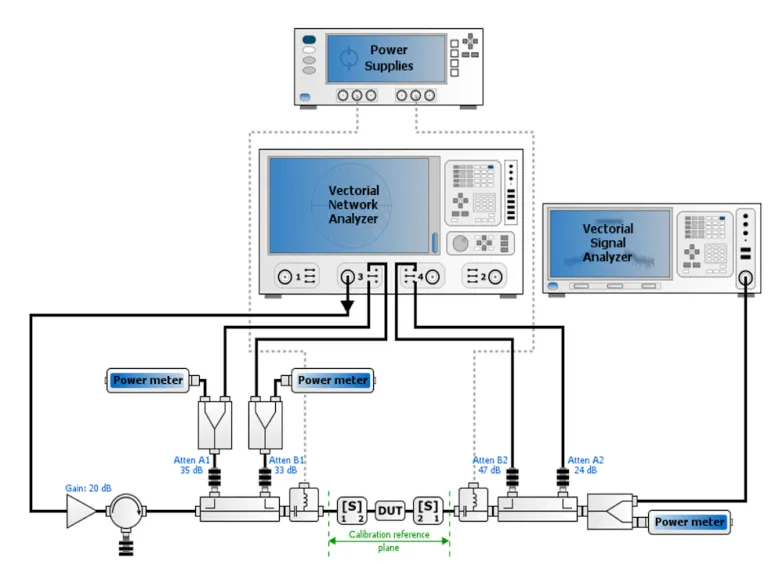
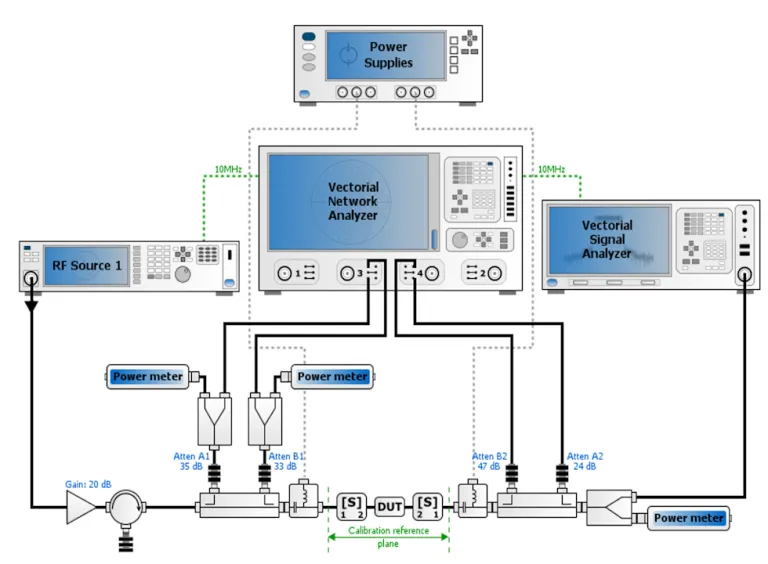
The Vector Bench module adds control of Vector Network Analyzer (VNA) to perform nonlinear measurements. With such a setup, the amplitude and phase information can be captured using the receivers of the VNA. When both measurement possibilities are enabled in the setup (Scalar and Vectorial), choosing which instruments to use for the characterization is possible by selecting the corresponding calibration.
Data is measured at the DUT reference plane. The correction terms are calculated during the calibration process using a step-by-step approach. Depending on the setup configuration, different calibrations can be performed.
Furthermore, the vector and power calibration can differ depending on the VNA configuration, which can be set to use three (3) or four (4) receivers. Therefore, to minimize the source of errors, IVF provides a state-of-the art calibration wizard that relies on the schematic setup to identify the type of calibration possible to perform and guides the end-user through all the steps, including the validation process verifying and assessing the expected accuracy.
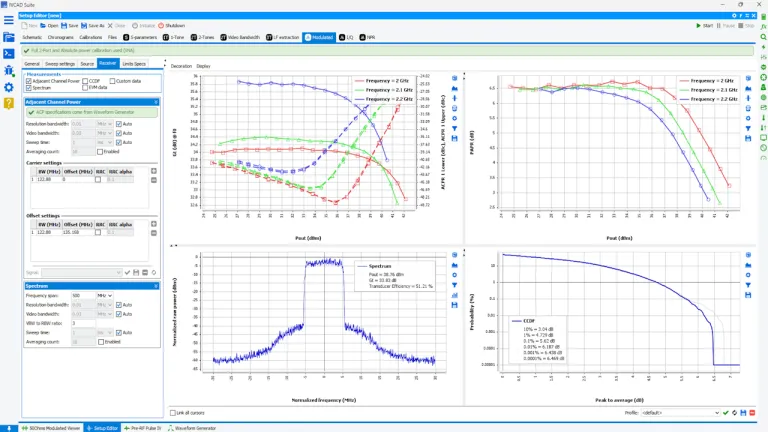
Explore New Horizons with Modulated Signal Control
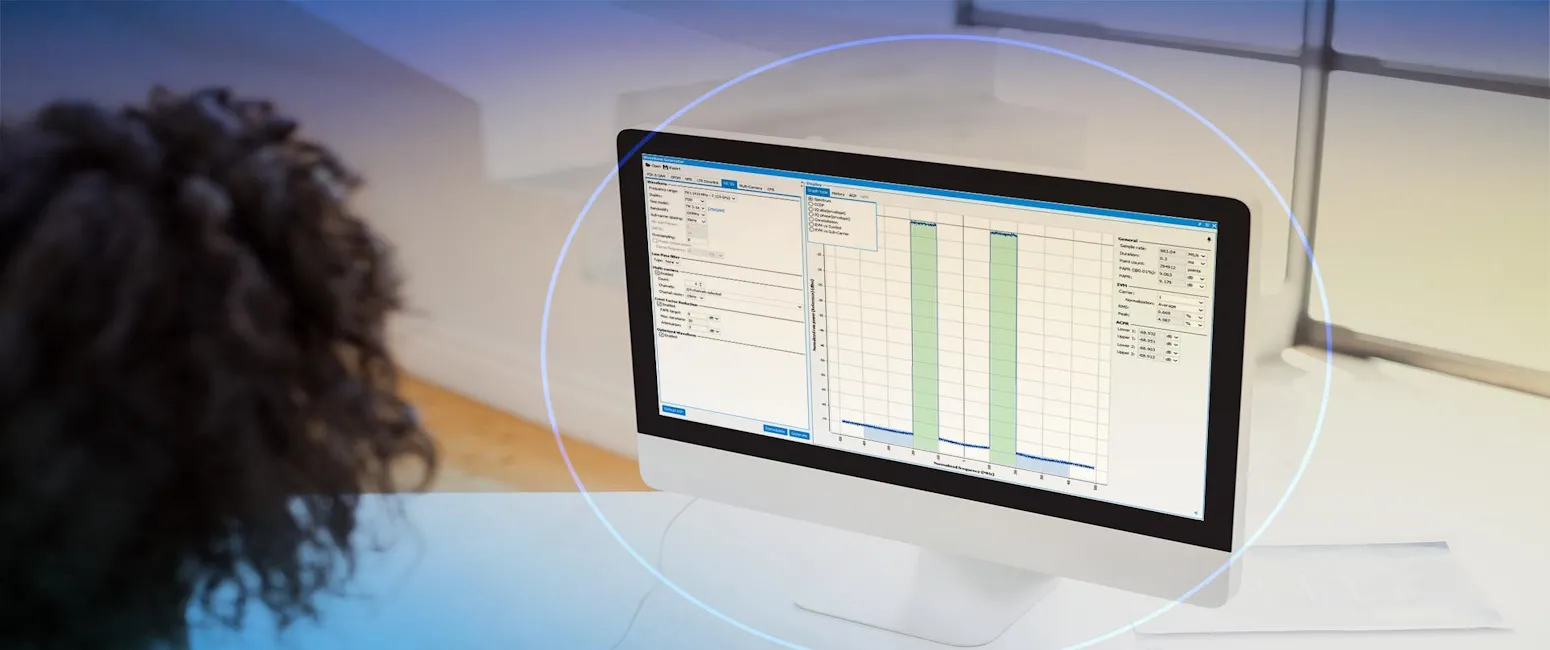
The growing complexity of wireless systems imposes a thorough and detailed characterization of RF power amplifiers using wideband signals. IVF enables high-speed and signals quality measurements to extract the DUT performances (EVM, ACPR, CCDF, PAPR…)
With full control of the vector signal generator, it is possible to set the modulation scheme manually with adequate settings and have IVCAD recall the required state on the instrument. Otherwise, it is possible to generate an IQ waveform using IVF Waveform Generator or any third-party software and use it directly by loading a text file containing the columns “I” and “Q”.
The Vector Network Analyzer or Signal analyzer, with appropriate options and power meters, is used to measure different parameters like:
- Adjacent Channel Power Ratio (ACPR)
- Error Vector Magnitude (EVM)- using Signal Analyzer only
- Complementary-Cumulative-Distribution-Function (CCDF)- using Signal Analyzer only
- Peak-to-Average Power Ratio (PAPR)- using Signal Analyzer only
- Spectrum
Observe Modulation Settings Impact on Real Time Data Display
IVF Modulation control supports multiple combinations of vector signal generators and signal analyzers from different vendors, allowing the test engineers to switch between instruments seamlessly and reduce the cost of ownership as he does not have to learn a new instrument user interface.
Power amplifier characterization using modulated signals requires instruments with different options to enable the modulation and demodulation personalities based on the modulated signal used. These options are necessary when signal demodulation is needed to measure the required parameters, like EVM. Moreover, Test engineers may need different EVM measurements (EVMavg, EVM peak, EVM rms) and developing drivers sustaining different instruments from different vendors and with multiple personalities becomes difficult to support.
Therefore, IVF embeds a user data configuration allowing the user to set the instrument in the right personality and fetch the parameter using SCPI commands. Multiple parameters can be measured in different configurations giving the user access to all the instrument’s capabilities
Virtual Test Bench Control Through the Unplugged Mode
Unplugged mode allows running virtual bench to develop script offline. With this module associated with the scripting tool, the development team can support their test engineers in automating measurements without depriving them of a license for IVCAD Standard (IVT) or Advanced Measurements (IVZ) that can be used on another bench.
Create setups, configurations, templates and sweep plans without the need to monopolize real measurement instruments for this activity; this way, the test instruments can be kept available for measurement activities.
This module is meant for development teams who want to create specific test sequences and debug such sweep plans in virtual mode before deploying them on the real test benches.
Different displays are made available, allowing single or multiple graphs. Depending on the performed measurements, an extensive list of graph types is predefined.
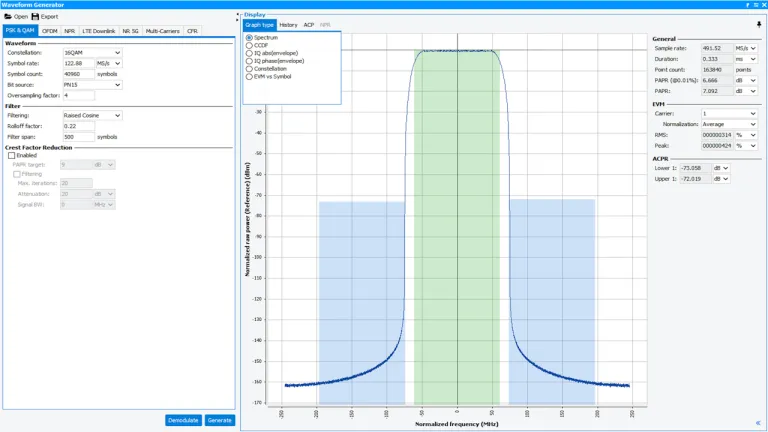
Generate and Demodulate Academic Waveforms
This module helps generate different waveforms used in modulated or IQ signal modules.
IVF embeds a basic waveform generator and demodulator that can create different PSK and QAM signals and inject them directly into the signal generator. This standalone module can be used independently , for measurement or simulation workflows.
The different waveforms can be used for different modulation schemes:
- PSK & QAM
- Custom OFDM
- Multi-Carrier Signal
- Crest Factor Reduction
The waveform can automatically generate the signal sent to the Vector Signal Generator or be exported to a *.txt file to be used with a third-party application.
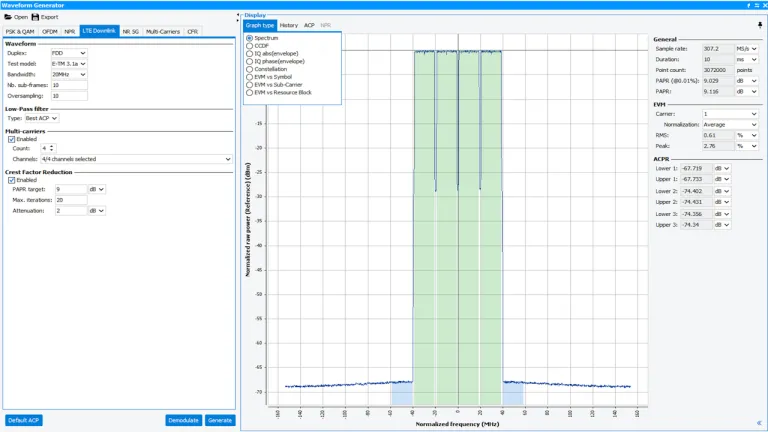
Use LTE Waveforms
The waveform generator introduces the capabilities to generate and demodulate an LTE signal by analyzing the IQ signal and calculating the EVM on symbols. This new module will manage directly the demodulation of the modulated signal in time domain, allowing a direct observation of the EVM constellation. The new module also supports multi-carriers.
The modulation and demodulation of the LTE signal is performed in accordance with the 3GPP compliance standards. New traces like EVM vs sub-carrier and EVM vs resource clock were added to the Whiteboard tool.
When ACP measurements and DPD analysis in IVCAD Measurement Standard module are required, the bandwidth of the VSA should be at least 4 to 5 times the signal bandwidth.
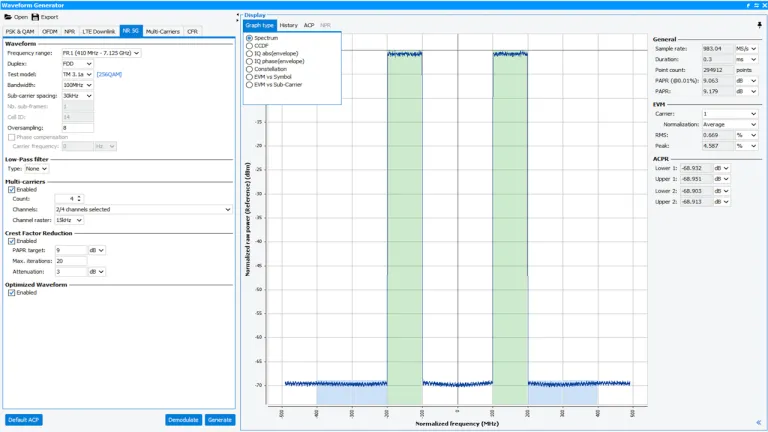
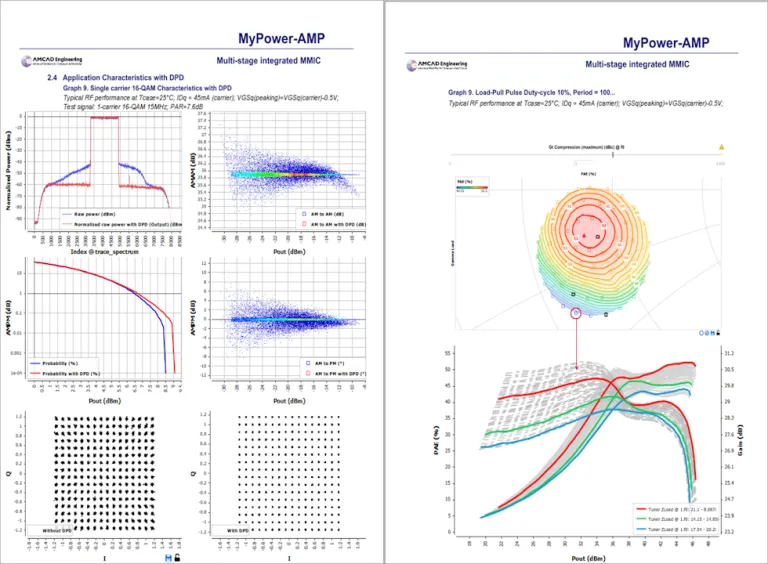
Test/Simulate Your Circuit with Realistic 5G NR Signals
This waveform generator generates and demodulates a 5G NR signal by analyzing the IQ signal in the time domain and calculating the EVM on symbols.
It handles signal demodulation and allows direct observation of the EVM constellation. It also supports 5G NR multi-carrier signals. The modulation and demodulation of the 5G NR signal complies with 3GPP compliance standards.
Demodulation of the 5G NR signal only requires that the vector signal analyzer used for testing has an instantaneous bandwidth that covers at least the signal bandwidth. When ACPR measurements and DPD analysis are required by the of the IVCAD Suite Standard Measurement plugin (IVT), the VSA bandwidth must be at least 4 to 5 times the signal bandwidth.
The waveform generator can compress 5G NR waveforms to improve measurement speed and facilitate data storage, while ensuring that power statistics and EVM results comply with 5G NR standards.
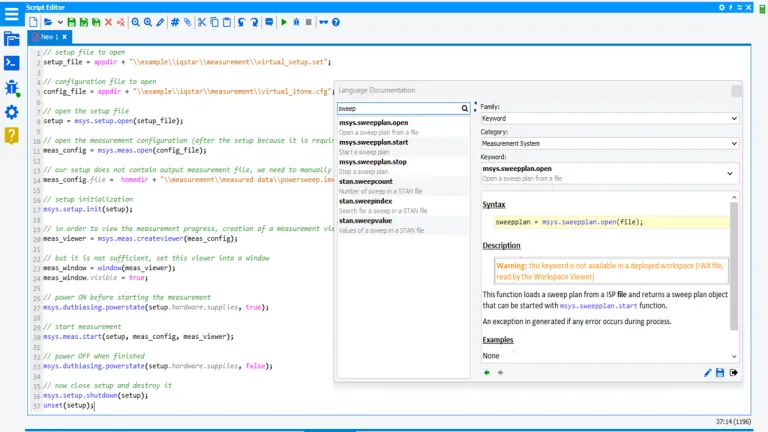
Script and Measure
Create your own program using the Scripting functionalities. Run personalized measurement sequences using the script built-in functions to embed all IVCAD native functionalities. Through a dedicated editor, the Script can also be launched in slave mode by a third-party application or software.
The script editor is divided into different categories:
- Measurements System: these functions allow full automation of the measurement process, including the setup creation, the measurement configurations, the device biasing and related optimizations, the wafer mapping and many more.
- Waveform scripting functions: These functions allow for generating Waveform modulation and demodulation with all the associated parameters.
- User Interface: these functions are related to creating 2D and 3D graphs, dialogue boxes, and different utilities.
- Math functions: an extensive mathematical library is available to compute all the necessary parameters. These functions include array manipulations like SVD and LU operations, polynomial modeling, curve fittings, and many more functions.
- Native: This category of functions is very useful when dealing with external DLL that must be controlled during the measurements.
- Net Visa: Dedicated Visa-based instruments control is allowed directly from the script to integrate additional instruments to the bench, like thermal chambers.
Script and Simulate
The scripting module can be used as a complementary solution to the whiteboard once the simulation has been generated.
The script provides complete control over the whiteboard project, from managing visualization pages to displaying data, including all controls (graphs, filters, buttons, etc.).
When a set of commands or functions needs to be executed multiple times or saved for later use, it can be developed and stored in a custom script.
In addition, built-in function libraries related to signal processing can be called and tested in a complete program based on the script editor language, thanks to the integrated development environment (IDE).
The script editor (IDE) offers powerful debugging functions to help programmers develop their own methods for data processing and in-depth analysis of results.
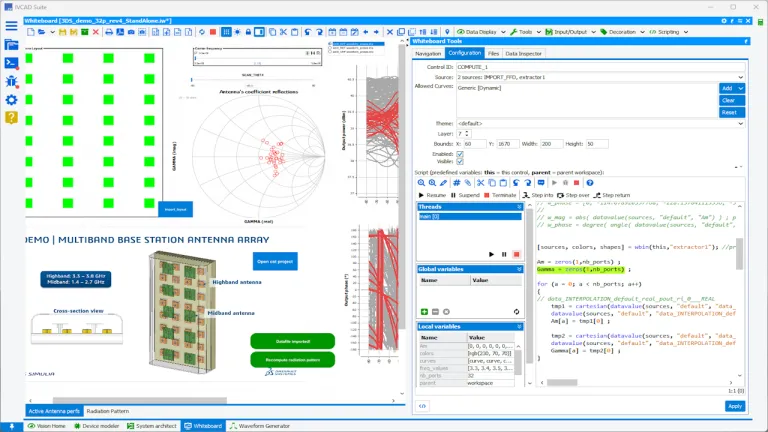
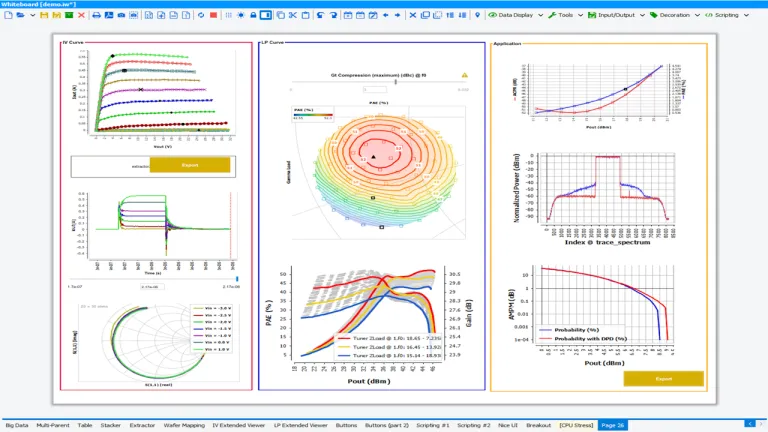
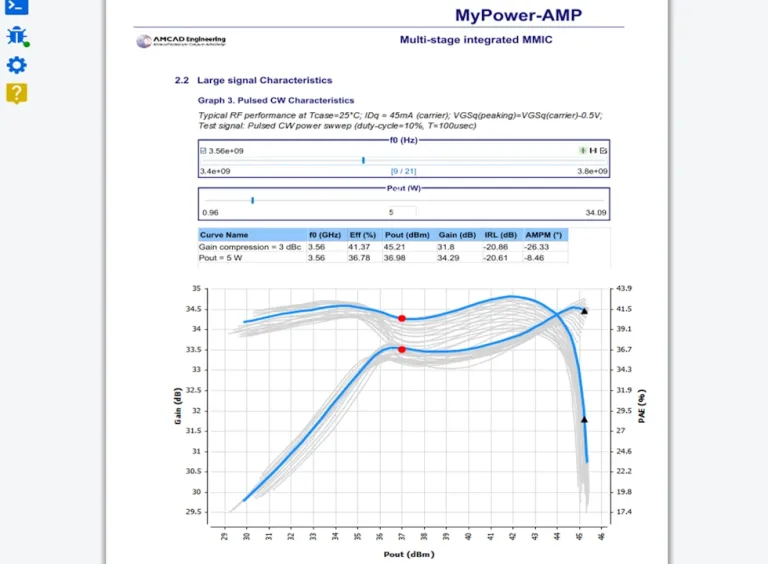
Leverage Your Data Successfully with the Whiteboard Editor
The Whiteboard is a tool needed by engineers and their teams or customers to analyze and leverage the data generated by their measurement setups and/or simulation software.
If in your workflow:
- You struggle with the limitation of your visualization Tool.
- You need to switch between different interfaces with different tools for different file formats.
- You need to manipulate multiple files to analyze some information.
- The number of graphs and displayed parameters is limited.
- You want to adjust your workspace to explore more in-depth the results obtained.
- You want to be more creative in the manner of presenting your results.
Then, the Whiteboard Editor is for you. This one allows the development of flexible data analysis templates tailored for your needs. It allows adjusting the visualization parameters and contains the necessary controls to make the interface more user-friendly and easier to read
The Whiteboard supports different measurement/simulation data in several formats given by IVCAD or third-party measurement platforms. You can easily display
- S-Parameters
- Nested frequency and Power sweeps
- Modulated Signal for different parameters
- Load Pull data to design matching circuits
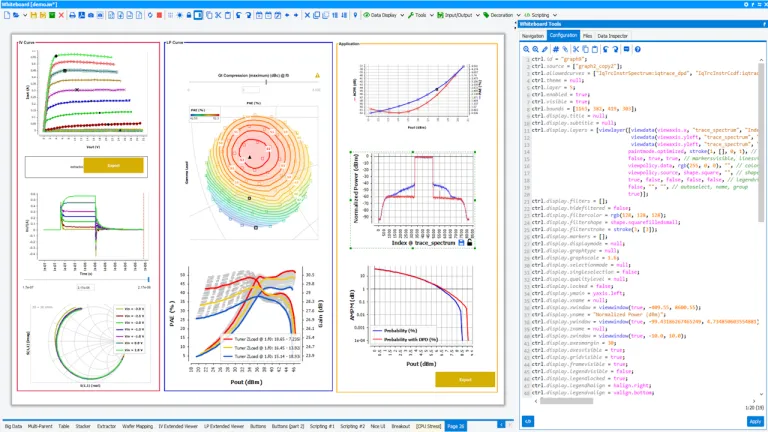
Predefined Tools to Customized Data Display
Defaults graphs are proposed according to the file formats and the data content. Drag on drop the chart frame, and pre-optimized figures are then displayed.
Adjust the visualization parameters and contains the necessary controls to make the interface more user-friendly and easier to read.
Data files can be multidimensional with customized parameters. Because of the potentially unlimited number of dimensions explored during the simulation work, the Whiteboard is an unrivaled tool when both flexibility and performance are needed to extract the files' core information.
If it’s important to display the behavior of the design or the device under multiple conditions, the Whiteboard data illustration is based on a “Parent-Child” structure.
This characteristic allows each control (Graph, Tables, Wafer, Filters…) to use data from either the input file or another control. Using a multipage structure, the analysis tool offers the possibility to arrange the workspace in dedicated sections for an enhanced user experience. The data can be displayed in different formats:
- Graphs (XY, Polar, Smith Charts, 2D and 3D)
- Tables
- Equations
- Pictures
Multiple controls are available to navigate through the data and extract desired parameters:
- Filters allow displaying curves at specific conditions like frequency, date, temperature…
- Converters allow converting specific curve types (S-parameters, Power Sweep, Video-Bandwidth, Modulated Power Sweep...) into "Generic" ones to compare data from different sources.
- Mergers allow merging multiple curves type in one.
- Extractors allow extracting curve values at specific conditions (Pout level, Pin level, Gain compression, ACPR level ...) through an interpolation process.
- Stackers allow stacking multiple curves to generate 3D graphs.
The user has full control of each graph's position, and size and the interface can be enhanced with explanatory text, banners, and images to make the analysis experience clearer and more user-friendly.
An RF Simulator Just to Analyze Data is an Overkill
The Deployment add-on of the Whiteboard is provided to help users which face issues like:
- Lack of standardization of the data analysis process inside a given group of users.
- Limited numbers of available licenses of the software
- Time wasting in generating reports for colleagues and customers.
- Different iterations to provide static reports to support customer requests.
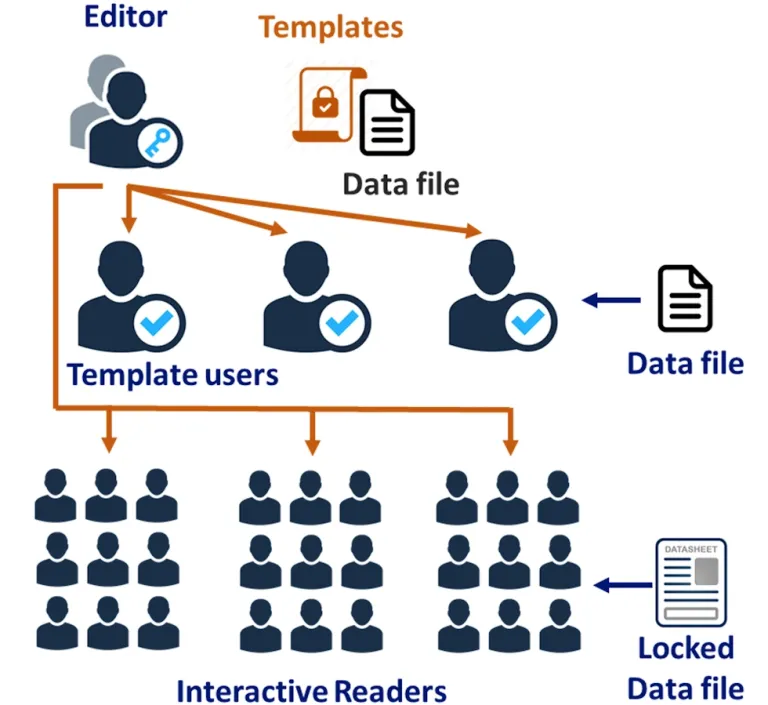
When the Whiteboard Editor generates a new version of the template, the deployment tool helps the user sharing this personalized template with a group of data readers. It helps to standardize the data analysis process within its company or with customers in the format of an interactive report.
This option offers a competitive tool that supports a company's growth by providing the right means to complete the work and provides a flexible solution in a timely manner.
Share the Results of Your Work
IVCAD is a unique RF software which has been designed to support this particular need when related to simulation workflow.
The Whiteboard Deployment option allows generating a workspace to be shared within the company or with a group of users while allowing access to interactive data analysis controls and even to load other data source files.
Two Deployment options are possible with this module:
- Whiteboard Deployed Viewer
- Whiteboard Deployed Free Viewer
Standardize the Visualization Tools across Your Business
By generating a customized template, the whiteboard editor provides an enhanced team experience when using the company's data. It also decreases the time wasted by your team in managing the data because the postprocessing template is already qualified and ready to be used by the user group.
The Whiteboard Deployed Viewers are multiple copies of the workspace. This allows new data generated during measurement or simulation work to be reloaded in real time, and the data analysis template built using the Whiteboard Editor to be reused to exploit this data fully and quickly.
By sharing all the interface's interactive capabilities applicable to an unlimited number of data files given by a simulator or a measurement bench, the team experience is greatly improved as the viewer tool streamlines everyone’s data workflows
Create Your Global Footprint
The Free Viewer delivered through the Deployment tool enables the opening of your templates associated with specific data files.
The number of copies is unlimited, and directly managed by the owner of the Whiteboard Editor
Field engineers usually aim to generate data reports. Then, they want to share these reports within the company and with their end customers across the world to promote their product specifications because of the latest performances, but they are facing some issues:
- Multiple simulation/measurement iterations lead to multiple reports
- Static documents lead to multiple questions from customers to see the results under a different angle
- The spread of information is limited if the reader requires a specific paid license to open the file.
- Reduce the time spent collecting the data for your contacts and remain focused on core activity
This interactive reports allows readers changing some simulation/measurement conditions and see the impact in real time. Through a simple selection, the data file populates all the graphs and tables in the final report with the new values.
Also Discover

Extract transistor models for circuit simulation and circuit models for system simulation

Run Stability Analysis of MMIC Circuits, Perform System Simulation using behavioral models

Conduct advanced tests on RF transistors for model extraction, begin passive load pull measurements, and test and linearize RF power amplifiers.

Waveguide measurement setups ctrl, Active Load Pull measurements, Data generation for advanced component and circuit modeling
Learn What SIMULIA Can Do for You
Speak with a SIMULIA expert to learn how our solutions enable seamless collaboration and sustainable innovation at organizations of every size.
Get Started
Courses and classes are available for students, academia, professionals and companies. Find the right SIMULIA training for you.
Get Help
Find information on software & hardware certification, software downloads, user documentation, support contact and services offering